Till now we have covered Requirements Module, Test Plan Module, Test Lab Module and Defects Module of Quality Center. In this article we’ll discuss Dashboard Module.
Dashboard Module enables a user to create customized reports. Knowledge of SQL and VB Scripting is required, as queries should be written in SQL for fetching the details of various modules in QC.
Here is a step by step introduction to Dashboard module.
- Open QC application and provide the valid user name and password. Select the domain name and the required project name from the drop down list.
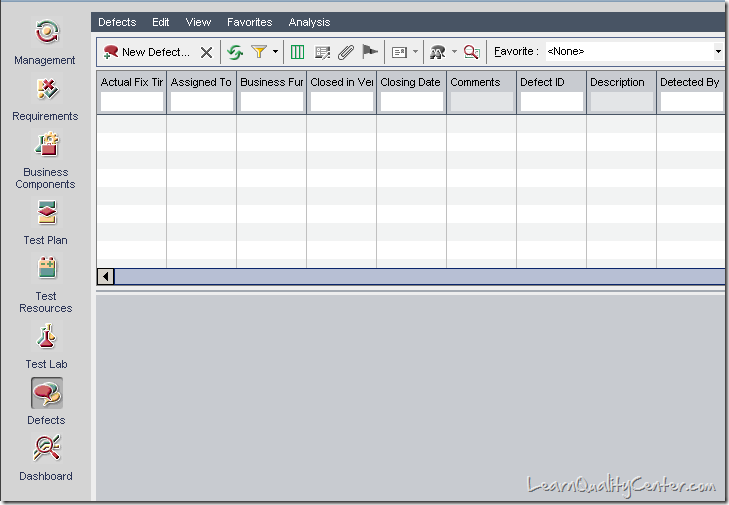
- Click on the “Dashboard†module present on the left hand side corner of the application as shown below.
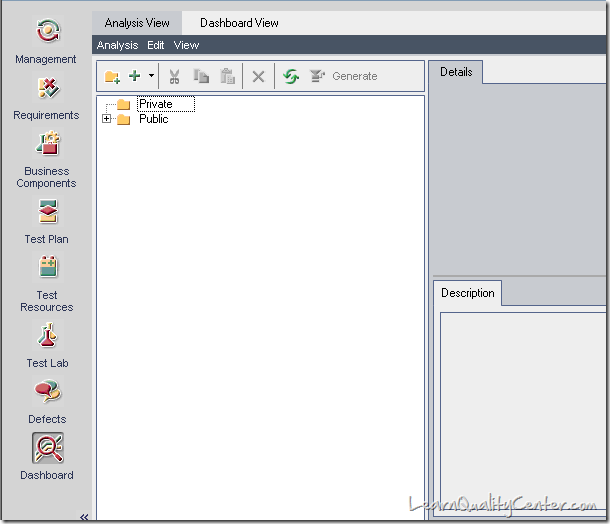
- The window opens as shown above. We find two tabs in the menu bar “Analysis View†and “Dashboard Viewâ€.
- Click on Analysis View and the user can find two folders by default “Private†and “Publicâ€. A user can create the reports in private folder and only he/she can view the report and nobody else can look into the report present in private folder. A report created in public folder can be viewed by everyone who have access to the particular project.
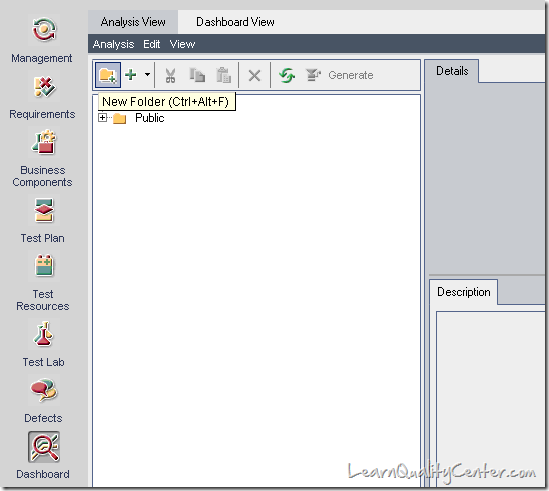
- Click on the New folder(Ctrl+Alt+F) option present below the menu bar to create a new folder.
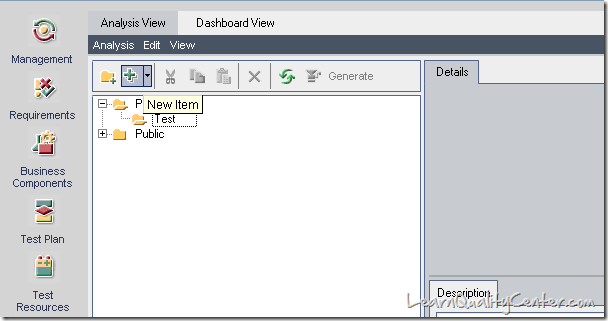
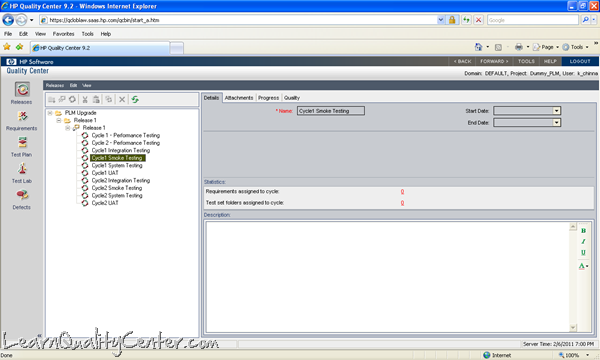
- Navigate on the new folder created and click on the new Item option present below the menu bar for creating a new report.
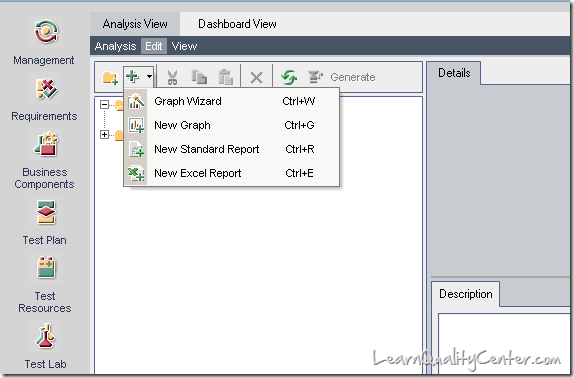
- Once the user clicks on the option “New Item†four options will be available to choose. Select “New Excel Report†for creating a customized report.
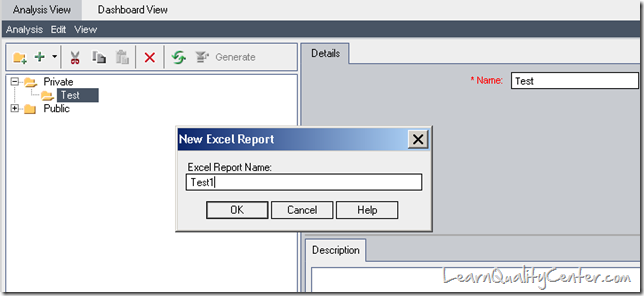
- Once the option “New Excel Report†is selected a pop up opens up asking the user to enter the name of the new report. Provide a name for the report as shown below.
- Once the user clicks on OK a new blank report is created under the Test folder as shown below.
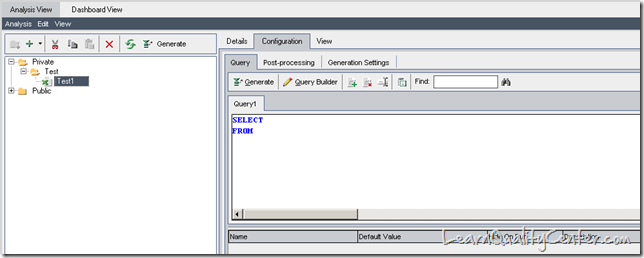
- The user can view three options on the menu bar Details,Configuration and View
- Details – This tab contains the name of the new report, Owner, Type of report etc.
- Configuration – This tab contains the actual query, Post Processing section and all the other options for generating the report.
- View – This tab contains the data and the report results of the report generated.
- Under the Configuration tab we have three more sub tabs as mentioned below.
- Query – Here the user can write SQL queries for every module
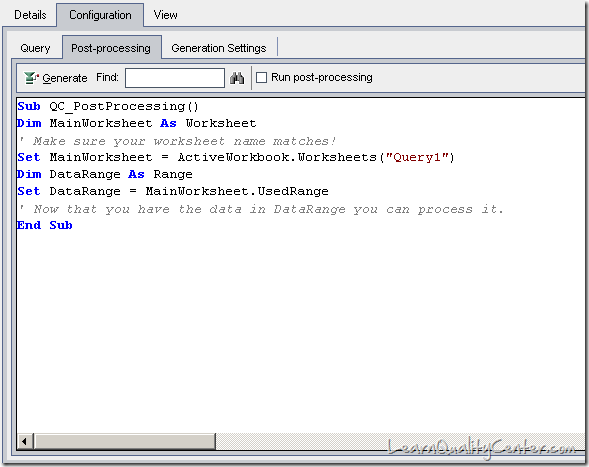
- Post Processing – The user needs to write VB Scripts for getting the data received from the queries in a readymade fashion. For Example:- A user writes a query to get the defects logged by him/her but when the user runs the query an excel sheet is generated which gives data in a raw format.But with Post processing section a user can readily get the count of the defects logged without filtering the data in the excel sheet.
- Generation Settings – This tab gives user the information of the path where the reports will be saved.
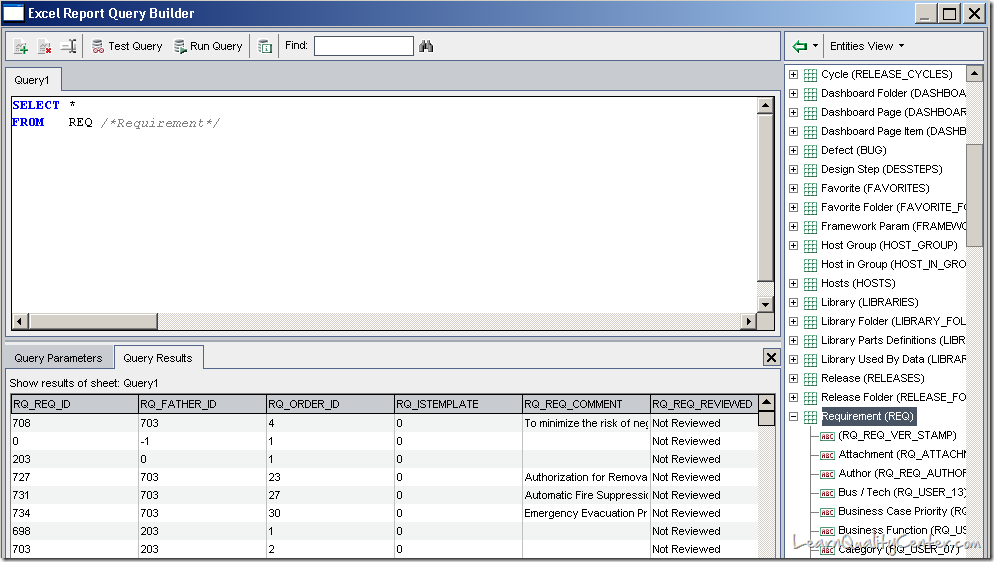
- Click on “Query Builder†option present beside the Generate tab. The following tab opens as shown below.
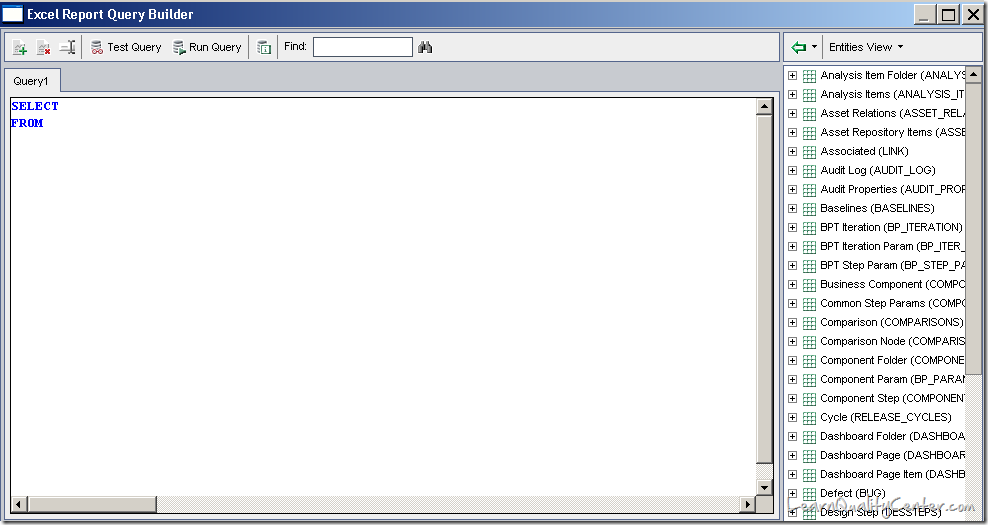
- The Entities present on the right hand side of the window are the table names and the corresponding field names. The user should pull the required table name and the fields required for generating the report.
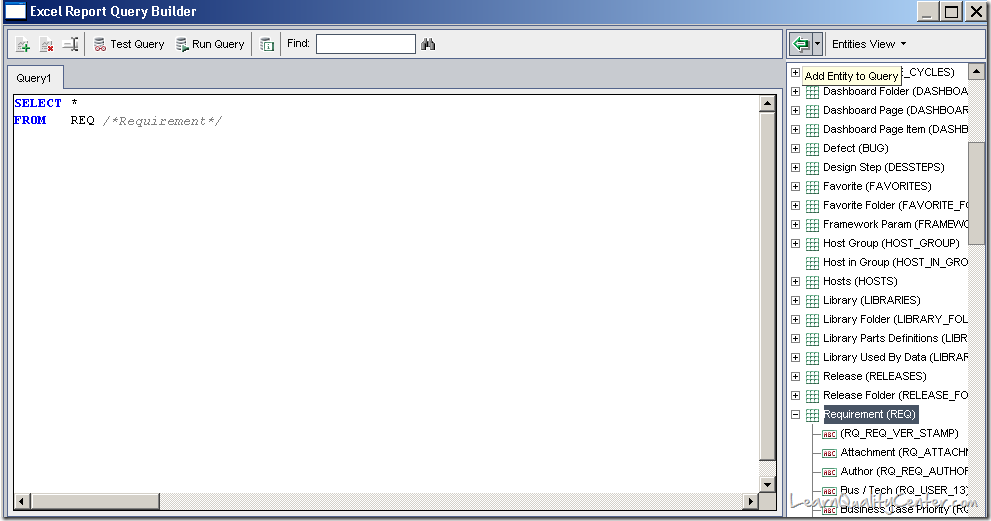
- As per the snap shot above, we have selected *(select all the fields from the table name) from Requirements table name which pops up all the field names present in the Requirements module.
- Once the user clicks on “Run Query†the Query builder runs the query and gives the results to the user as shown below.
- A user can perform the following operations:
- Add Query – A User can add multiple queries by clicking on this option for different modules.
- Delete Query – A user can delete the existing queries.
- Rename Query – A query can be renamed by clicking on this option.
- Test Query – This option is used to test a query for a limited set of values (max 10).
- Run Query – This option is used to test a query for all the values present in the particular module.
- A user should write the VB Script in the post processing section for generating a readymade report.
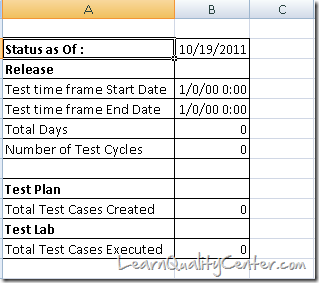
- This is a sample report generated after inputting the query and the writing a VB script in the post processing section.
With that we come to the end of Dashboard module. I hope you like this article.
If you’re planning to take Quality Center Certification, don’t forget to check our mock QC certification questions.




 initiative
This is the first time i came to know about dashboard module. The way you explained the thing was nice.
Posted by Deepak | November 30, 2011, 10:43 amHi,
This is nice article…If you could share us the common queries need for any project using SQL-Query,Post Processing
it will be perfect
Posted by kedarahiranmai | February 16, 2012, 12:09 pmThis is very informatic article i came across. I have asked by manager to find out how can be utilize this tab. If you can explain or you have any document which you think might help me. that’will be great help.
Posted by Kirti | March 7, 2012, 2:10 amthank you so much,this article is very much cleared like real time project
Posted by adarsh | May 1, 2012, 4:38 pmThank you so much to provide such information about QC
Posted by mahboob | June 11, 2012, 9:42 pmThis is informative and useful.Thanks for posted.
Posted by Sreekaram Sreekar | July 13, 2012, 9:06 amHow do I add the Bar Chart icon to the Dashboard Module
Posted by Kevin | August 1, 2012, 12:54 amInformation provided is toooo good. Wish to try the same and post my feedback..
Posted by Ragav | August 16, 2012, 9:33 pmTHank you so much.Now I came to know about QC dashboard.Thanks once again
Posted by VIgnesh | October 7, 2012, 8:10 pmIt’s really nice.
Posted by Nitin | February 28, 2013, 1:01 pmIs there any way, wherein i can get the SQL queries generated for the Standard reports created in QC?
(writing manual queries for the standard reports is very difficult)
I have a requirement of pulling the reports from QC, and broadcast it on daily basis. hence need to automate this process.
Posted by Bhaskar | August 13, 2013, 3:30 pmHi.
I am beginning to work with ALM. Development Area is beginning too. The problem is Quality Assurance Area has not this tools (ALM). The question is con Dashboard, ¿can I build a pdf with the evidences of my testing, for I can pass my test a other areas or inclusived to show to other collegues the advanced in the use of ALM?
Thanks
Posted by Diana Decunto | August 21, 2013, 4:04 amAfter generating this data in an excel sheet. How do you refresh data?
1> Is there an Addin which can be used to connect SQL DB and refresh ?
2> Do we always have to logon to QC to refresh data?
What are the options?
Posted by manny | March 14, 2014, 10:46 pmIf I understand this correctly the only way to get any formating of an Excel report other than standard spreadsheet is to write a VB script in hte Post Processing tab? Assuming this is true if somene runs the report in QC the report will be presented to them with the desired formating?
Thanks,
Posted by Roger Nall | March 18, 2014, 9:09 pmAbout Dash board in QC you have given explanation very nice,but you have missed few tabs in dash board,if you give those explanation also(Generation settings and views under analysis view,Dashboard view),it is very good to complete understand on Dash board.
Posted by Padmaja | April 14, 2014, 12:38 pmClear explanation easy to understand thanks, i have gained much knowledge about dashboard.
Posted by Bijjula sreevani | August 26, 2014, 4:57 pmThe article was very detailed and easy to understand.
It was really very good explanation and very helpful to my career growth.
Thanks,
Shareefha
Posted by shareefha | September 17, 2014, 3:39 pm